Inflation vs. Nominal: Decoding Historical Oil Price Swings for a Clearer Market View
Understanding the true trajectory of oil prices is far more complex than simply glancing at raw numbers. For anyone analyzing market trends, investing in energy, or simply trying to comprehend global economic shifts, distinguishing between nominal and inflation-adjusted prices is crucial. A well-designed
Oil Price Graph that presents both perspectives can illuminate historical patterns, expose misleading "shocks," and provide a more honest assessment of where prices truly stand in terms of purchasing power.
The Illusion of Nominal Prices: Why Context Matters
When we talk about the "nominal" price of oil, we're referring to the dollar value at the time of the transaction – "dollars at the time," unadjusted for the erosion of purchasing power due to inflation. While these figures are useful for real-time transactions, relying solely on them for historical analysis can be profoundly misleading. Over decades, the value of a dollar changes significantly; $100 in 1980 had far greater buying power than $100 today.
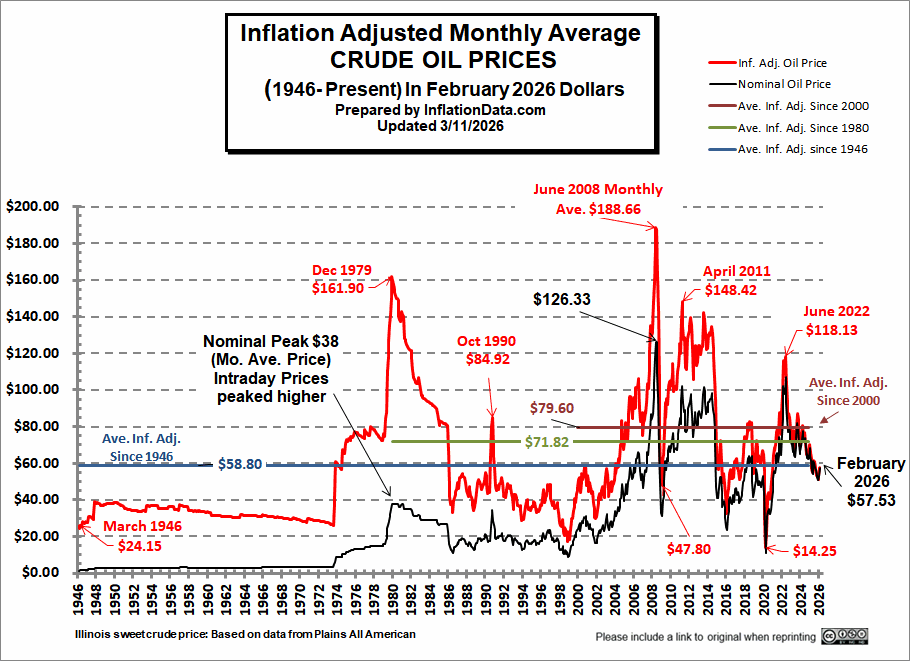
Consider a historical
Oil Price Graph depicting crude oil prices from, say, the 1970s to the present. You might observe dramatic spikes in the nominal price, creating an impression of unprecedented market volatility. For instance, comparing the oil price surges of the late 1970s/early 1980s with more recent increases. While the nominal price in both periods might reach similar numerical levels, the *inflation-adjusted* price tells a different story.
In the early 1980s, the rise in oil prices was truly dramatic, often occurring over a year or so. This rapid ascent had profound and immediate shocks on global economies. Fast forward to more recent periods (e.g., the mid-2000s or even specific rallies in the 2020s), and while nominal prices might climb steadily, an inflation-adjusted graph often reveals that we have, in fact, reached comparable real price levels before. The major difference is often the *pace* of the increase: a gradual, multi-year climb versus an abrupt, crisis-driven spike.
An
Oil Price Graph that clearly displays both lines—nominal and inflation-adjusted—provides invaluable context. The "real" or inflation-adjusted price strips away the distorting effect of inflation, allowing us to compare past and present prices on an equal footing regarding actual purchasing power. This perspective reveals whether today's prices are genuinely unprecedented in real terms or simply reflect a devalued currency.
Decoding the Oil Price Graph: Beyond the Numbers
Not all data visualizations are created equal. A truly informative
Oil Price Graph goes beyond just plotting two lines. It embodies clarity, accuracy, and utility, empowering viewers to extract genuine insights rather than succumb to misinterpretations.
Here's what to look for and appreciate in a well-designed oil price chart:
- Dual Perspective: As emphasized, the inclusion of both nominal and inflation-adjusted price lines is paramount. They should be clearly differentiated, perhaps by color, and labeled precisely.
- Clear Axes and Labels: The Y-axis (price) should indicate units (e.g., USD per barrel), and the X-axis (time) should have legible and appropriately spaced dates.
- Interactive Features: Advanced online graphs often include interactive elements, such as bullet points or tooltips that appear when you hover over specific points, offering additional data or historical context for significant price movements. This can link price changes to specific geopolitical events, economic crises, or technological shifts.
- Comprehensive Data Range: A good graph will cover a substantial historical period, allowing for a broader understanding of long-term cycles rather than just short-term fluctuations.
- Source Transparency: Reputable sources will always clearly state where their data comes from, bolstering credibility.
Conversely, many charts suffer from common flaws that obscure rather than illuminate. Charts attempting to show complex data like "Use vs. Population" or "The China Factor" might use confusing legends, unreadable maps, or ineffective bar and pie chart formats that fail to convey per-capita figures or comparative growth accurately. When viewing any
Oil Price Graph or related data, always be critical. Ask: Are the figures clearly presented? Can I easily compare different metrics? Does it avoid common visual distortions? Focus on charts that offer specific, quantifiable measures, like per-capita demand over time, presented in an unambiguous manner.
What Drives the Real Price: Beyond the Graph
While historical graphs provide essential context, the live crude oil price you see today is a dynamic reflection of a complex interplay of global factors. This is where real-time data, like that offered by platforms such as Oilprice.com, becomes indispensable, offering current prices for over 150 global crude blends and indexes, complete with live charts and analytical tools.
The "spot price" of oil represents the present price at which crude oil (the physical asset with minimal processing) can be purchased or sold on the market for immediate delivery. This price is typically quoted per barrel and denominated in U.S. dollars globally, regardless of the oil's origin.
Two of the most prominent crude oil blends are Brent Crude and West Texas Intermediate (WTI). Understanding their differences is key to grasping global oil markets. Brent crude is primarily extracted from North Sea reserves, often under the seafloor, while WTI crude is typically sourced from landlocked reserves in the United States, like the Permian Basin. These geographical and geological distinctions lead to differences in extraction processes, transportation costs, and ultimately, their spot prices. For a deeper dive into these key benchmarks, explore our guide on
Brent vs. WTI: Your Guide to Today's Live Crude Oil Spot Prices.
Beyond these physical characteristics, market factors are the true determinants of crude oil spot prices. These include:
- Supply Dynamics: Decisions by major oil-producing nations and organizations (like OPEC+), new discoveries, technological advancements in extraction, and production costs significantly influence supply.
- Demand Dynamics: Global economic growth, industrial activity, transportation sector needs, and consumer behavior (e.g., shift to electric vehicles) all drive demand.
- Geopolitical Events: Conflicts, political instability in oil-producing regions, sanctions, and trade wars can disrupt supply chains or create uncertainty, causing prices to spike.
- Market Regulations and Speculation: Government policies, environmental regulations, and the activities of financial speculators who bet on future price movements also play a significant role in shaping the live Oil Price Graph.
- U.S. Dollar Strength: Since oil is priced in USD, fluctuations in the dollar's value can impact oil prices for countries using other currencies.
These interconnected factors create a constantly moving target for oil prices, making real-time monitoring and sophisticated analysis essential. To understand the intricate dance of these market forces, read our analysis on
Analyzing Crude Oil: Key Factors Driving Today's Market Prices.
Conclusion
Deciphering the true narrative of oil prices demands a nuanced approach, moving beyond the face value of nominal figures. By embracing inflation-adjusted data, presented effectively within a comprehensive
Oil Price Graph, we gain a far clearer understanding of historical market movements and their actual economic impact. This historical perspective, combined with a keen awareness of the complex interplay of supply, demand, geopolitics, and market dynamics that drive today's live spot prices, empowers investors, policymakers, and consumers alike to make more informed decisions in an ever-fluctuating global energy landscape. The journey of oil prices is not merely a string of numbers, but a reflection of global economic health, technological progress, and political realities – a story best told with all the relevant context.